Numpy、Pandas、Matplotlib的简单使用
标签: Python编程之路
1.Numpy
Numpy:提供了一个在Python中做科学计算的基础库,重在数值计算,主要用于多维数组(矩阵)处理的库。用来存储和处理大型矩阵,比Python自身的嵌套列表结构要高效的多。本身是由C语言开发,是个很基础的扩展,Python其余的科学计算扩展大部分都是以此为基础。
1.1 创建数组
NumPy数组是一个多维的数组对象(矩阵),称为ndarray,具有矢量算术运算能力和复杂的广播能力,并具有执行速度快和节省空间的特点。
- Numpy创建一维数组
# coding:utf-8
import numpy as np

# numpy创建数组
t1 = np.array(range(10))
print("t1 {}".format(t1))
print("t1的对象类型:{}".format(type(t1)))
print("t1的数据类型:{}".format(t1.dtype))

t2 = np.arange(10)
print("t2 {}".format(t2))
print("t2的对象类型:{}".format(type(t2)))
print("t2的数据类型:{}".format(t2.dtype))

# 指定数据类型
import random
list_num = [random.random() for i in range(10)]
t3 = np.array(list_num, dtype="f2")
print("t3 {}".format(t3.round(3)))
print("t3的对象类型:{}".format(type(t3)))
print("t3的数据类型:{}".format(t3.dtype))
结果
t1 [0 1 2 3 4 5 6 7 8 9]
t1的对象类型:<class 'numpy.ndarray'>
t1的数据类型:int64
t2 [0 1 2 3 4 5 6 7 8 9]
t2的对象类型:<class 'numpy.ndarray'>
t2的数据类型:int64
t3 [0.468 0.768 0.896 0.136 0.345 0.646 0.842 0.525 0.556 0.526]
t3的对象类型:<class 'numpy.ndarray'>
t3的数据类型:float16
- Numpy常见数据类型
| 类型 | 类型代码 | 描述 |
|---|---|---|
| int8, uint8 | i1, u1 | 有符号和无符号的8位(1个字节) 整型 |
| int16, uint16 | i2, u2 | 有符号和无符号的16位(2个字节) 整型 |
| int32, uint32 | i4, u4 | 有符号和无符号的32位(4个字节) 整型 |
| int64, uint64 | i8, u8 | 有符号和无符号的16位(2个字节) 整型 |
| float16 | f2 | 半精度浮点数 |
| float32 | f4 or f | 单精度浮点数, 与c的float兼容 |
| float64 | f8 or d | 双精度浮点数, 与c的double兼容 |
| float128 | f16 or g | 扩展精度浮点数 |
| complex64 、complex128、complex256 | c8 、c16、c32 | 分别用两个32位、64位或128位浮点数表示的复数 |
| bool | 布尔类型,True 或者 False |
通过astype方法可以修改数据类型
In [39]: t1 = np.array(range(10))

In [40]: print(t1.dtype)
int64

In [41]: t1.astype('int32')
Out[41]: array([0, 1, 2, 3, 4, 5, 6, 7, 8, 9], dtype=int32)
- 其他创建数组的方法
import numpy as np


# 全零数组
zeros_arr = np.zeros((4,3))
print("zeros_arr: {}".format(zeros_arr))

# 全为1的数组
ones_arr = np.ones((4,3))
print("ones_arr: {}".format(ones_arr))

# 初始化数组
empty_arr = np.empty((4, 3), int) # 这里指定下数据类型
print("empty_arr: {}".format(empty_arr))

# 随机创建数组np.random
# 生成指定维度大小(3行4列)的随机多维浮点型数据(二维),rand固定区间0.0 ~ 1.0
rand_arr = np.random.rand(3, 4)
print(rand_arr)

# 生成指定维度大小(3行4列)的随机多维整型数据(二维),randint()可以指定区间(-1, 5)
randint_arr = np.random.randint(-1, 5, size = (3, 4)) # 'size='可省略
print(randint_arr)
- shape属性和reshape()方法
通过shape可以查看数组的形状,通过reshape()可以重置数组的形状
In [12]: t4 = np.arange(24)

In [13]: print(t4.shape)
(24,)  # 一行一列数组,里面有24个数据

In [14]: t5 = t4.reshape(2, 12)

In [15]: print(t5)
[[ 0  1  2  3  4  5  6  7  8  9 10 11]
 [12 13 14 15 16 17 18 19 20 21 22 23]]

In [16]: print(t5.shape)
(2, 12)  # 2行12列

In [17]: t6 = t5.flatten()  # 将数组展开成一维数组

In [18]: print(t6)
[ 0  1  2  3  4  5  6  7  8  9 10 11 12 13 14 15 16 17 18 19 20 21 22 23]
1.2 ndarray的运算
- 相同大小数组间的运算
import numpy as np

arr_num = np.arange(1,7).reshape(2,3)
print(arr_num)

# 相同大小数组间运算应用
# 矩阵相乘
arr_pro = arr_num * arr_num
print("---矩阵相乘---")
print(arr_pro)

# 矩阵相加
arr_pro = arr_num * arr_num
print("---矩阵相加---")
print(arr_pro)
结果
[[1 2 3]
 [4 5 6]]
---矩阵相乘---
[[ 1  4  9]
 [16 25 36]]
---矩阵相加---
[[ 1  4  9]
 [16 25 36]]
- 矢量与标量(数组和数之间的运算)
import numpy as np

# 数组与数的计算
# 加法
arr_num = np.arange(1,7).reshape(2,3)
print(arr_num)

arr_num_add = arr_num + 5
print(arr_num_add)

# 乘法
arr_num_pro = arr_num * 5
print(arr_num_pro)
结果
这是numpy的广播机制,数组与数做加减乘除时, 将数"广播"到数组各个元素。
- 不同维度数组的运算
# 不同维度数组间的计算
arr_num1 = np.arange(1,13).reshape(3,4)

arr_num2 = np.arange(1,5)

arr_num3 = np.arange(1,4).reshape(3,1)

arr_num4 = np.arange(1,9).reshape(2,4)

print(arr_num1*arr_num2)
"""
结果输出
[[ 1  4  9 16]
 [ 5 12 21 32]
 [ 9 20 33 48]]
"""
print(arr_num1 * arr_num3)
"""
结果输出
[[ 1  2  3  4]
 [10 12 14 16]
 [27 30 33 36]]
"""
print(arr_num1 * arr_num4)
"""
ValueError: operands could not be broadcast together with shapes (3,4) (2,4)

数组广播原则:
如果两个数组的后缘维度(即从末尾算起的维度)的轴长相等,或者其中一个数组后续维度的轴长为1,则认为这两个数组是广播兼容的,广播会在缺失和(或)长度为1的轴上进行
"""
1.2 Numpy 轴axis的概念
在numpy中轴可以理解为方向的意思,使用0,1,2…数字表示。
对于一个一维数组,她只有一个0轴,对于2维数组(shape(3,4)),有0轴和1轴,对于三维数组(shape(4,2, 3)),有0,1,2轴。
- 二维数组的轴

- 三维数组的轴

1.3 Numpy 数组索引与切片操作
示例
In [46]: t1 = np.arange(24).reshape(4, 6)

In [47]: t1
Out[47]:
array([[ 0,  1,  2,  3,  4,  5],
      [ 6,  7,  8,  9, 10, 11],
      [12, 13, 14, 15, 16, 17],
      [18, 19, 20, 21, 22, 23]])

In [48]: t1[1]   # 取第二行数据
Out[48]: array([ 6,  7,  8,  9, 10, 11])

In [49]: t1[1:]  # 取第二行和后面所有数据
Out[49]:
array([[ 6,  7,  8,  9, 10, 11],
      [12, 13, 14, 15, 16, 17],
      [18, 19, 20, 21, 22, 23]])

In [50]: t1[:,2]  # 取第三列的数据
Out[50]: array([ 2,  8, 14, 20])

In [51]: t1[[1, 2],2] # 取第二行和第三行的第二列数据
Out[51]: array([ 8, 14])

In [53]: t1[[0,1],[0,2]]  # 取不相邻的点的数据
Out[53]: array([0, 8])

In [54]: t1[t1>3]  # 布尔索引
Out[54]:
array([ 4,  5,  6,  7,  8,  9, 10, 11, 12, 13, 14, 15, 16, 17, 18, 19, 20,
      21, 22, 23])

In [56]: np.where(t1<10, 0, 10)  # 类似三目运算符
Out[56]:
array([[ 0,  0,  0,  0,  0,  0],
      [ 0,  0,  0,  0, 10, 10],
      [10, 10, 10, 10, 10, 10],
      [10, 10, 10, 10, 10, 10]])
1.4常用方法
| 方法 | 说明 |
|---|---|
| ceil() | 向上最接近的整数,参数是 number 或 array |
| floor() | 向下最接近的整数,参数是 number 或 array |
| rint() | 四舍五入,参数是 number 或 array |
| isnan() | 判断元素是否为 NaN(Not a Number),参数是 number 或 array |
| multiply() | 元素相乘,参数是 number 或 array |
| divide() | 元素相除,参数是 number 或 array |
| abs() | 元素的绝对值,参数是 number 或 array |
| where(condition, x, y) | 三元运算符,x if condition else y |
| vstack() | 垂直拼接 |
| hstack() | 水平拼接 |
更多使用参考 https://numpy.org/doc/stable/user/index.html
2.Pandas
Pandas是一个强大的分析结构化数据的工具集,基于NumPy构建,提供了 高级数据结构 和 数据操作工具,它是使Python成为强大而高效的数据分析环境的重要因素之一。
参考文档 https://www.pypandas.cn/
2.1 Pandas 数据结构
Pandas有两个最主要也是最重要的数据结构: Series 和 DataFrame
- Series
Series是一种类似于一维数组的 对象,由一组数据(各种NumPy数据类型)以及一组与之对应的索引(数据标签)组成。
import pandas as pd

p1 = pd.Series([1, 2, 3, 4, 5], index=list("abcde"))
print(p1)

p2_dict = {"name":'张三', 'age':18, 'email':'[email protected]'}
p2 = pd.Series(p2_dict)
print(p2)
结果
a    1
b    2
c    3
d    4
e    5
dtype: int64
name                   张三
age                    18
email    [email protected]
dtype: object
- DataFrame 二维
DataFrame是一个表格型的数据结构,它含有一组有序的列,每列可以是不同类型的值。DataFrame既有行索引也有列索引,它可以被看做是由Series组成的字典(共用同一个索引),数据是以二维结构存放的。
import pandas as pd
import numpy as np

p3 = pd.DataFrame(np.arange(12).reshape(3,4), index=list('abc'), columns=list("abcd"))
print(p3)
print(type(p3))
print("index:{}".format(p3.index))
print("columns:{}".format(p3.columns))
print("values:{}".format(p3.values))
结果
   a  b   c   d
a  0  1   2   3
b  4  5   6   7
c  8  9  10  11
<class 'pandas.core.frame.DataFrame'>
index:Index(['a', 'b', 'c'], dtype='object')
columns:Index(['a', 'b', 'c', 'd'], dtype='object')
values:[[ 0  1  2  3]
 [ 4  5  6  7]
 [ 8  9 10 11]]
2.2索引和切片操作
- Series 索引和切片操作
import pandas as pd

p2_dict = {"name":'张三', 'age':18, 'email':'[email protected]', 'tel':18210001000,
           'class_num':3}

p2 = pd.Series(p2_dict)
# print(p2)
print(p2[1])
print(p2['name'])
print(p2[1:3])
print(p2.head(1))
print(p2.tail(1))
- DataFrame 索引和切片操作
from pymongo import MongoClient
import pandas as pd

# 从本机mongdb中读取一些数据
client = MongoClient()
collection = client['douban']['tv1']
data = list(collection.find())
# 数据简单处理下
data_list = []
for i in data:
    temp = {}
    temp['title'] = i['title']
    temp['actors'] = i['actors']
    data_list.append(temp)
df = pd.DataFrame(data_list)
print(df)
"""
结果
          title                    actors
0          白夜追凶            [潘粤明, 王泷正, 梁缘]
1       那年花开月正圆             [孙俪, 陈晓, 何润东]
2          无证之罪             [秦昊, 邓家佳, 姚橹]
3            河神            [李现, 张铭恩, 王紫璇]
4         无心法师2            [韩东君, 陈瑶, 李兰迪]
...         ...                       ...
2374       钱的战争         [草剪刚, 大岛优子, 木村文乃]
2375       月之恋人        [木村拓哉, 筱原凉子, 松田翔太]
2376  埃及艳后般的女人们          [佐藤隆太, 稻森泉, 北乃绮]
2377     葵 德川三代        [津川雅彦, 西田敏行, 岩下志麻]
2378       我们的家  [芦田爱菜, 夏洛特·凯特·福克斯, 山本耕史]

[2379 rows x 2 columns]
"""
print(df.head()) # 默认输出前5条
"""
结果:
     title          actors
0     白夜追凶  [潘粤明, 王泷正, 梁缘]
1  那年花开月正圆   [孙俪, 陈晓, 何润东]
2     无证之罪   [秦昊, 邓家佳, 姚橹]
3       河神  [李现, 张铭恩, 王紫璇]
4    无心法师2  [韩东君, 陈瑶, 李兰迪]
"""
print(df.head(2))
"""
结果:
     title          actors
0     白夜追凶  [潘粤明, 王泷正, 梁缘]
1  那年花开月正圆   [孙俪, 陈晓, 何润东]
"""
print(df.tail())  # 默认输出后五条
"""
结果
          title                    actors
2374       钱的战争         [草剪刚, 大岛优子, 木村文乃]
2375       月之恋人        [木村拓哉, 筱原凉子, 松田翔太]
2376  埃及艳后般的女人们          [佐藤隆太, 稻森泉, 北乃绮]
2377     葵 德川三代        [津川雅彦, 西田敏行, 岩下志麻]
2378       我们的家  [芦田爱菜, 夏洛特·凯特·福克斯, 山本耕史]
"""
print(df.tail(2))
"""
结果
       title                    actors
2377  葵 德川三代        [津川雅彦, 西田敏行, 岩下志麻]
2378    我们的家  [芦田爱菜, 夏洛特·凯特·福克斯, 山本耕史]
"""
print(df.info()) # df的概要信息
"""
结果
<class 'pandas.core.frame.DataFrame'>
RangeIndex: 2379 entries, 0 to 2378
Data columns (total 2 columns):
 #   Column  Non-Null Count  Dtype
---  ------  --------------  -----
 0   title   2379 non-null   object
 1   actors  2379 non-null   object
dtypes: object(2)
memory usage: 37.3+ KB
None
"""
print(df[:10]) # 获取前10条数据
"""
结果
         title           actors
0         白夜追凶   [潘粤明, 王泷正, 梁缘]
1      那年花开月正圆    [孙俪, 陈晓, 何润东]
2         无证之罪    [秦昊, 邓家佳, 姚橹]
3           河神   [李现, 张铭恩, 王紫璇]
4        无心法师2   [韩东君, 陈瑶, 李兰迪]
5     春风十里,不如你  [周冬雨, 张一山, 尤靖茹]
6      秦时丽人明月心  [迪丽热巴, 张彬彬, 李泰]
7      颤抖吧,阿部!  [郑业成, 安悦溪, 赵东泽]
8      人间至味是清欢  [佟大为, 陈乔恩, 王一博]
9  大军师司马懿之军师联盟    [吴秀波, 刘涛, 李晨]
"""
print(df.loc[0])  # loc通过标签索引获取数据, 里面的参数0指的索引标签
"""
title               白夜追凶
actors    [潘粤明, 王泷正, 梁缘]
Name: 0, dtype: object
"""
print(df.loc[[0, 3, 5]])
"""
结果
      title           actors
0      白夜追凶   [潘粤明, 王泷正, 梁缘]
3        河神   [李现, 张铭恩, 王紫璇]
5  春风十里,不如你  [周冬雨, 张一山, 尤靖茹]
"""
print(df.loc[[1, 3, 10], 'title'])
"""
结果:
1     那年花开月正圆
3          河神
10        醉玲珑
Name: title, dtype: object
"""
print(df.loc[[1, 3, 10], ['title', 'actors']])
"""
      title           actors
1   那年花开月正圆    [孙俪, 陈晓, 何润东]
3        河神   [李现, 张铭恩, 王紫璇]
10      醉玲珑  [刘诗诗, 陈伟霆, 徐海乔]
"""
print(df.iloc[1])  # iloc通过位置获取数据
"""
结果
title           那年花开月正圆
actors    [孙俪, 陈晓, 何润东]
Name: 1, dtype: object
"""
print(df.iloc[[1, ], [1,]])
"""
结果:
          actors
1  [孙俪, 陈晓, 何润东]
"""

# 布尔索引
# 重新构建下数据
data_list = []
for i in data:
    temp = {}
    temp['title'] = i['title']
    temp['actors'] = i['actors']
    temp['rating_count'] = i['rating']['count']
    temp['total'] = i['total']
    data_list.append(temp)

df = pd.DataFrame(data_list)
print(df.head())
"""
结果:
     title          actors  rating_count
0     白夜追凶  [潘粤明, 王泷正, 梁缘]         23043
1  那年花开月正圆   [孙俪, 陈晓, 何润东]         20867
2     无证之罪   [秦昊, 邓家佳, 姚橹]          4753
3       河神  [李现, 张铭恩, 王紫璇]         58453
4    无心法师2  [韩东君, 陈瑶, 李兰迪]         12495
"""
# 取rating_count大于58000的数据
print(df[df['rating_count']>58000])
"""
结果
         title               actors  rating_count
3           河神       [李现, 张铭恩, 王紫璇]         58453
12       我的前半生        [靳东, 马伊琍, 袁泉]         82540
13      余罪 第一季        [张一山, 吴优, 常戎]         72341
21       人民的名义        [陆毅, 柯蓝, 张丰毅]        170243
23    三生三世十里桃花       [杨幂, 赵又廷, 张智尧]         93616
...        ...                  ...           ...
1938     交响情人梦      [上野树里, 玉木宏, 瑛太]         84523
1961     1公升的泪  [泽尻英龙华, 锦户亮, 药师丸博子]         67283
1963     最后的朋友     [长泽雅美, 上野树里, 瑛太]         74377
2002      一吻定情   [矢作穗香, 古川雄辉, 山田裕贵]         82734
2008     野猪大改造   [龟梨和也, 山下智久, 堀北真希]         71538

[68 rows x 3 columns]
"""
# 取rating_count大于58000的数据小于60000的数据
print(df[(df['rating_count']>58000) & (df['rating_count']<60000)])
"""
结果:
      title                      actors  rating_count
3         河神              [李现, 张铭恩, 王紫璇]         58453
38       红楼梦             [欧阳奋强, 陈晓旭, 邓婕]         59775
79      士兵突击             [王宝强, 陈思诚, 段奕宏]         59391
88     仙剑奇侠传              [胡歌, 刘亦菲, 安以轩]         59968
100      择天记              [鹿晗, 古力娜扎, 吴倩]         59957
172       蜗居                [海清, 李念, 郝平]         59284
518      兄弟连  [戴米恩·路易斯, 唐尼·沃尔伯格, 朗·里维斯顿]         59890
1410   主君的太阳             [苏志燮, 孔晓振, 徐仁国]         59169
1458  原来是美男啊             [张根硕, 朴信惠, 郑容和]         58017
1603    我的女孩             [李栋旭, 李多海, 李准基]         59494
"""
2.3 缺失数据的处理
数据缺失通常有两种情况:
1)就是空,None等,在pandas是NaN
2)设置为0的数据
NaN数据处理:
在pandas中判断数据是否为NaN, 可以通过 pd.isnull(df),pd.notnull(df)
方式1:删除NaN所在的行列
dropna (axis=0, how='any', inplace=False)
方式2:填充数据
t.fillna(t.mean())
t.fiallna(t.median())
t.fillna(0)
具体需要根据实际情况来进行缺失数据的处理。
pandas中计算平均值等时,nan数据是不参与计算的
2.4 数据合并join和merge
import pandas as pd
import numpy as np

pf1 = pd.DataFrame(np.ones((2, 4)), index=["A", 'B'], columns=list('abcd'))
print(pf1)

pf2 = pd.DataFrame(np.zeros((3, 3)), index=['A', 'B', 'C'], columns=list('xyz'))
print(pf2)

pf3 = pd.DataFrame(np.arange(9).reshape(3,3), columns=list('fbx'))
print(pf3)

# join按行index 索引拼接
print(pf1.join(pf2))
print(pf2.join(pf1))

# merge按列索引拼接,默认内连接 inner 交集
print(pf1.merge(pf3, on='b'))
print(pf1.merge(pf3, on='b', how='outer')) # 并集
print(pf1.merge(pf3, on='b', how='left'))
print(pf1.merge(pf3, on='b', how='right'))
print(pf1.merge(pf3, left_on='a', right_on='b'))
更多操作 参考 https://www.pypandas.cn/docs/
3.数据可视化工具
3.1 matplotlib
Matplotlib 是一个 Python 的 2D绘图库,通过 Matplotlib,开发者可以仅需要几行代码,便可以生成绘图,直方图,功率谱,条形图,错误图,散点图等。
参考文档 https://matplotlib.org/users/index.html
折线图示例
"""
绘制10点到12点的气温变化折线图
"""

import random
from matplotlib import font_manager
from matplotlib import pyplot as plt

# 设置中文字体
font_conf = font_manager.FontProperties(fname="/usr/share/fonts/wps-office/msyhbd.ttf")

x = range(0, 120)  # 时间
y_bj = [random.randint(18, 35) for i in range(120)] # 假定这是北京是每日10-12点的气温
y_shanghai = [random.randint(18, 35) for i in range(120)]
# 设置图片尺寸和像素
plt.figure(figsize=(20, 10), dpi=80)

plt.plot(x, y_bj, label='bj')
plt.plot(x, y_shanghai,label='shanghai')

# x轴标签
x_ticks = x[::5]
x_labels_1 = ["10:{}".format(i) for i in range(60)]
x_labels_2 = ["11:{}".format(i) for i in range(60)]
x_labels = x_labels_1 + x_labels_2
# y轴标签
y_ticks = [i for i in range(0, 40, 5)]
y_labels = [ "{}摄氏度".format(i) for i in range(0,40,5)]

plt.xticks(ticks=x_ticks, labels=x_labels[::5])
plt.yticks(ticks=y_ticks, labels=y_labels,fontproperties=font_conf)

# 添加描述
plt.xlabel("时间", fontproperties=font_conf)
plt.ylabel('温度,摄氏度', fontproperties=font_conf)
plt.title('10点至12点的气温表',fontproperties=font_conf)

# 绘制网格,alpha透明度
plt.grid(alpha=0.4) #

# 添加图例
plt.legend(loc='best', prop=font_conf)

plt.savefig('今日10-12点气温.png')
plt.show()
结果

散点图示例:
# coding=utf-8
"""
绘制2月份和3月份气温的散点图
"""
from matplotlib import pyplot as plt
from matplotlib import font_manager

# 设置中文字体
my_font = font_manager.FontProperties(fname="/usr/share/fonts/wps-office/msyhbd.ttf")

y_2 = [10,12,11,11,12,8,12,6,6,9,8,9,12,15,14,17,18,21,16,17,20,14,15,15,15,19,21,22,22,22,23]
y_3 = [26,26,28,19,21,17,16,19,23,20,21,12,22,23,15,20,21,20,22,15,11,15,5,13,17,10,11,13,12,13,6]

x_2 = range(1,32)
x_3 = range(50,81)

#设置图形大小
plt.figure(figsize=(20,8),dpi=80)

#使用scatter方法绘制散点图
plt.scatter(x_2,y_2,label="2月份")
plt.scatter(x_3,y_3,label="3月份")

#调整x轴的刻度
xtick = list(x_2)+list(x_3)
xtick_labels = ["2月{}日".format(i) for i in x_2]
xtick_labels += ["3月{}日".format(i-20) for i in x_3]
plt.xticks(xtick[::3],xtick_labels[::3],fontproperties=my_font,rotation=45)

#添加图例
plt.legend(loc="upper left",prop=my_font)

#添加描述
plt.xlabel("时间",fontproperties=my_font)
plt.ylabel("温度",fontproperties=my_font)
plt.title("标题",fontproperties=my_font)

plt.savefig('2-3月份气温.png')
plt.show()
结果

智能推荐
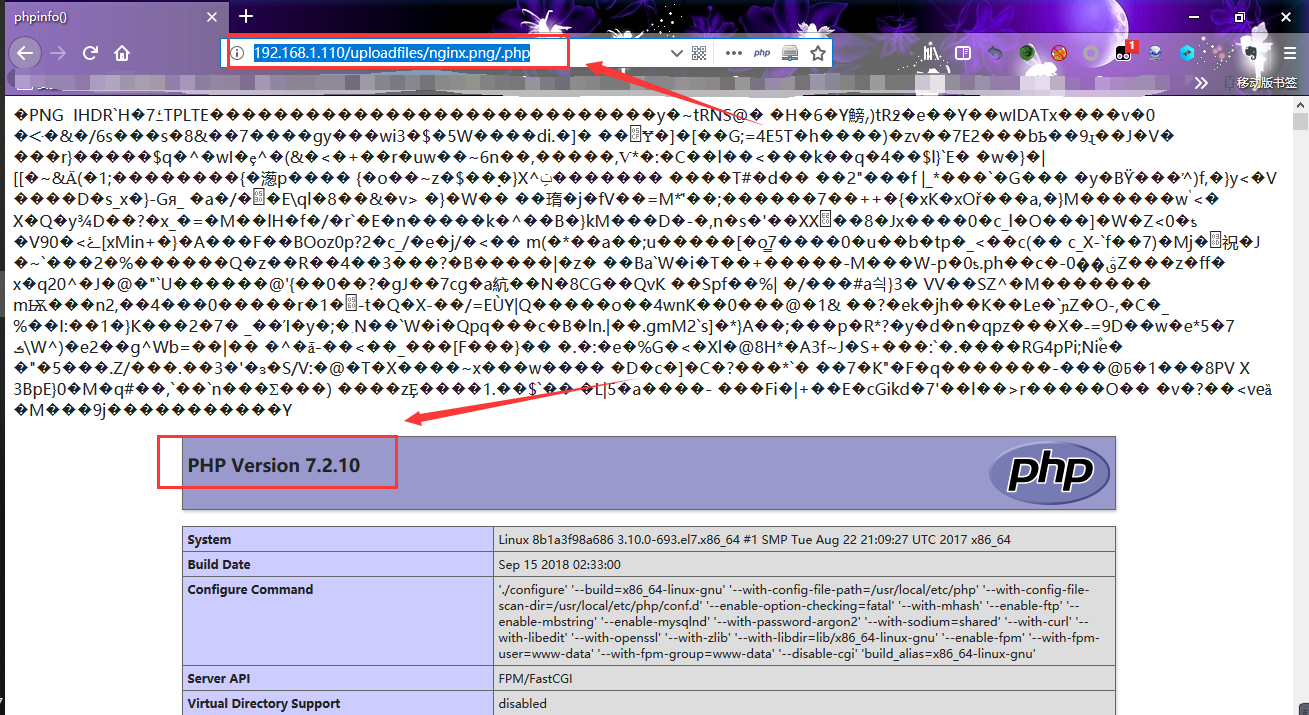
Nginx 解析漏洞复现
漏洞环境搭建 时间有限,漏洞环境搭建教程简单,在此不再赘述。 具体项目地址:https://github.com/vulhub/vulhub 搭建教程及说明可参考:https://vulhub.org/ -还是挺简单的- Nginx 解析漏洞复现步骤如下: 靶机环境 由此可知,该漏洞与Nginx、php版本无关,属于用户配置不当造成的解析漏洞。 启动环境 复现 1). 访问 http://IP/u...
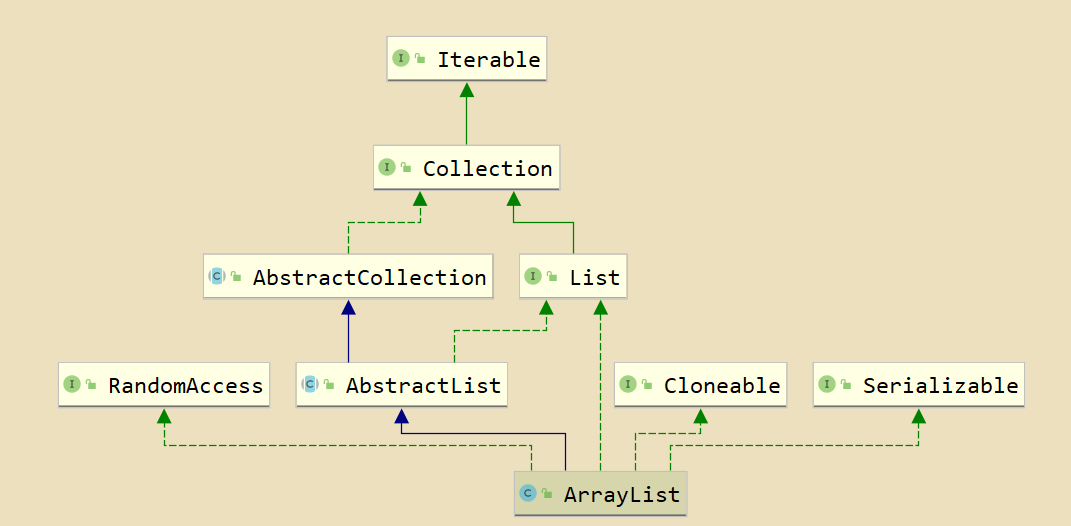
ArrayList 源码解析(JDK1.7)
ArrayList 源码解析(JDK1.7) ps: 我思考了一下…想要不要发这篇博客… 感觉作为一个初学者…发这种源码解析… 尤其当做学习记录这样的东西来做…感觉没有任何的重点可言… 不过思考了一下…反正估计也没人看 (狗头) 就发了吧 纯属个人 … emmm 萌新的学习经历- - 大...

GDB随笔(一)
在编译的时候必须加上-g,生成的目标文件才能够进行调试。(我们调试的是目标文件) -g选项的作用是在目标文件中加入源代码的信息,保证gdb能找到源文件。 -o选项,相当于指定一个文件作为目标文件。 可以做一个实验:由main.c生成main(-g),然后将m**在目标文件中加入源代码的信息,保证gdb能找到源文件。ain.c改成其他名字,然后调用gdb main,就会发现对gdb使用命令(list...

tensorboard报No dashboards are active for the current data set
遇到这个错误,通过两步可以解决这个问题 一、检查所指定的目录下是否存在event文件 类似于上面箭头所指的文件,并不需要所指定的目录为event的上一级目录,比如像下面这种情况 在启动tensorboard的时候,指定到log目录就行了,命令如下 二、确定logdir的路径是否正确 我们在确定event文件确实存在之后,还需要确定logdir的路径是否正确,因为logdir的路径中不能包含中文、空...

struts2--动态方法调用的三种方式
一般情况下,我们是通过实现action中execute方法来实现请求处理,这样子一个action中就只能写一个方法,当我需要实现很多方法的时候写多个action显然是很不合理的,因此就需要使用动态调用来实现。 方式一:指定method属性 也就是说通过在struts.xml文件中通过配置action标签的method属性来设置即可。 但是这个方法有一个缺陷,当一个action中有很多方法的时候就需...
猜你喜欢

深度剖析HashMap(一)——基于JDK7
HashMap是每个Java/Android程序员必须掌握的一种容器。在这个专题下将分若干篇文章对其进行深度剖析。由于JDK版本的不同,HashMap的底层实现也有些许差别。本文先对基于JDK7的HashMap进行分析,之后会奉上JDK8中对HashMap实现改动的分析。 一、HashMap结构概览 在JDK7中,HashMap说白了就是用到两种数据结构——数组与链表。 数...
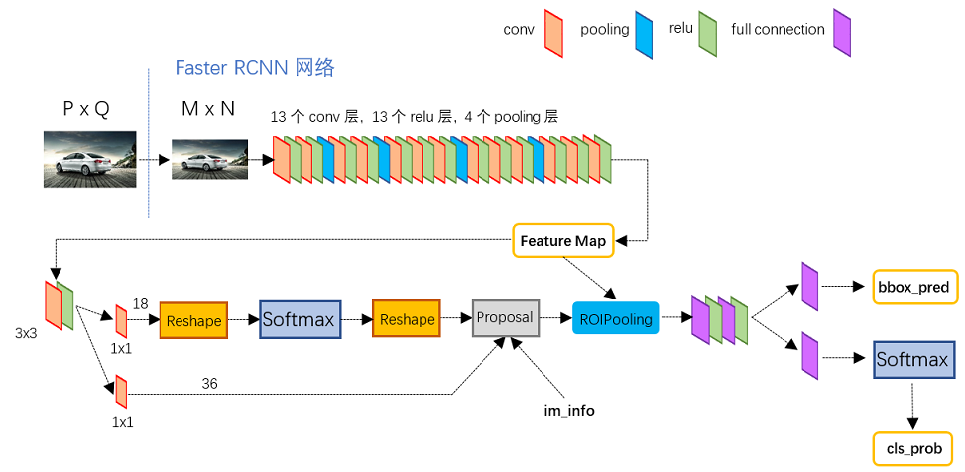
Faster R-CNN基于pytorch的原理
相关资料以及下载 代码地址:https://github.com/ruotianluo/pytorch-faster-rcnn.git 原理参考:https://blog.csdn.net/zm147451753/article/details/88218619 代码编译和运行 代码使用方法,暂时没找到win系统下的方法,为此,我安装了unbuntu,还是蛮好用的。 代码的编译运行准...
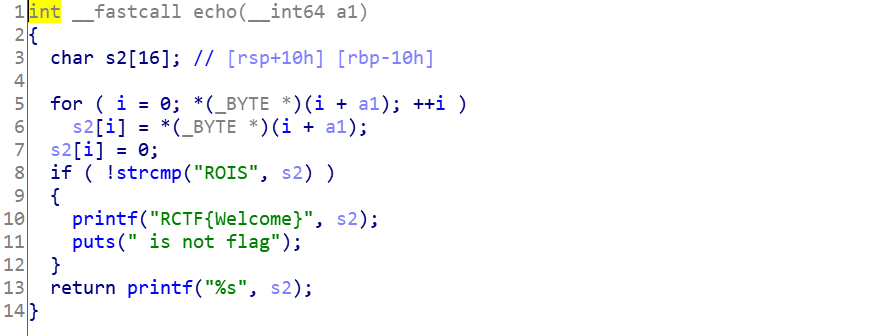
welpwn(RCTF-2015)--write up
文件下载地址: 链接:https://pan.baidu.com/s/1MG2z9r4wz_WTEz1vIikqJQ 提取码:3tbc 0x01.分析 checksec: 源码分析: 流程非常简单,首先输入一个1024大小字符串,然后进入函数echo,这个函数会将buf的数据一个字节一个字节的复制到s2中,当遇到x00时停止,退出,并打印s2。 寻找漏洞: 第一个read处没有漏洞,但...

mongodb+java实现日志的日活与月活查询
业务介绍 前段时间有个日志统计的需求,是规范的登陆日志,估计一个月有几十万,放入hadoop太麻烦了,放数据库又怕后续数据量增加较快,于是尝试用mongodb来存储,后续进行统计。 mongodb是采用3.4, 2017年12月最新的是3.6 中文官网的文档(英文官网的文档访问太坑爹了) http://www.mongoing.com/docs/crud.html 先查看下自己的系统,这里是选择用...
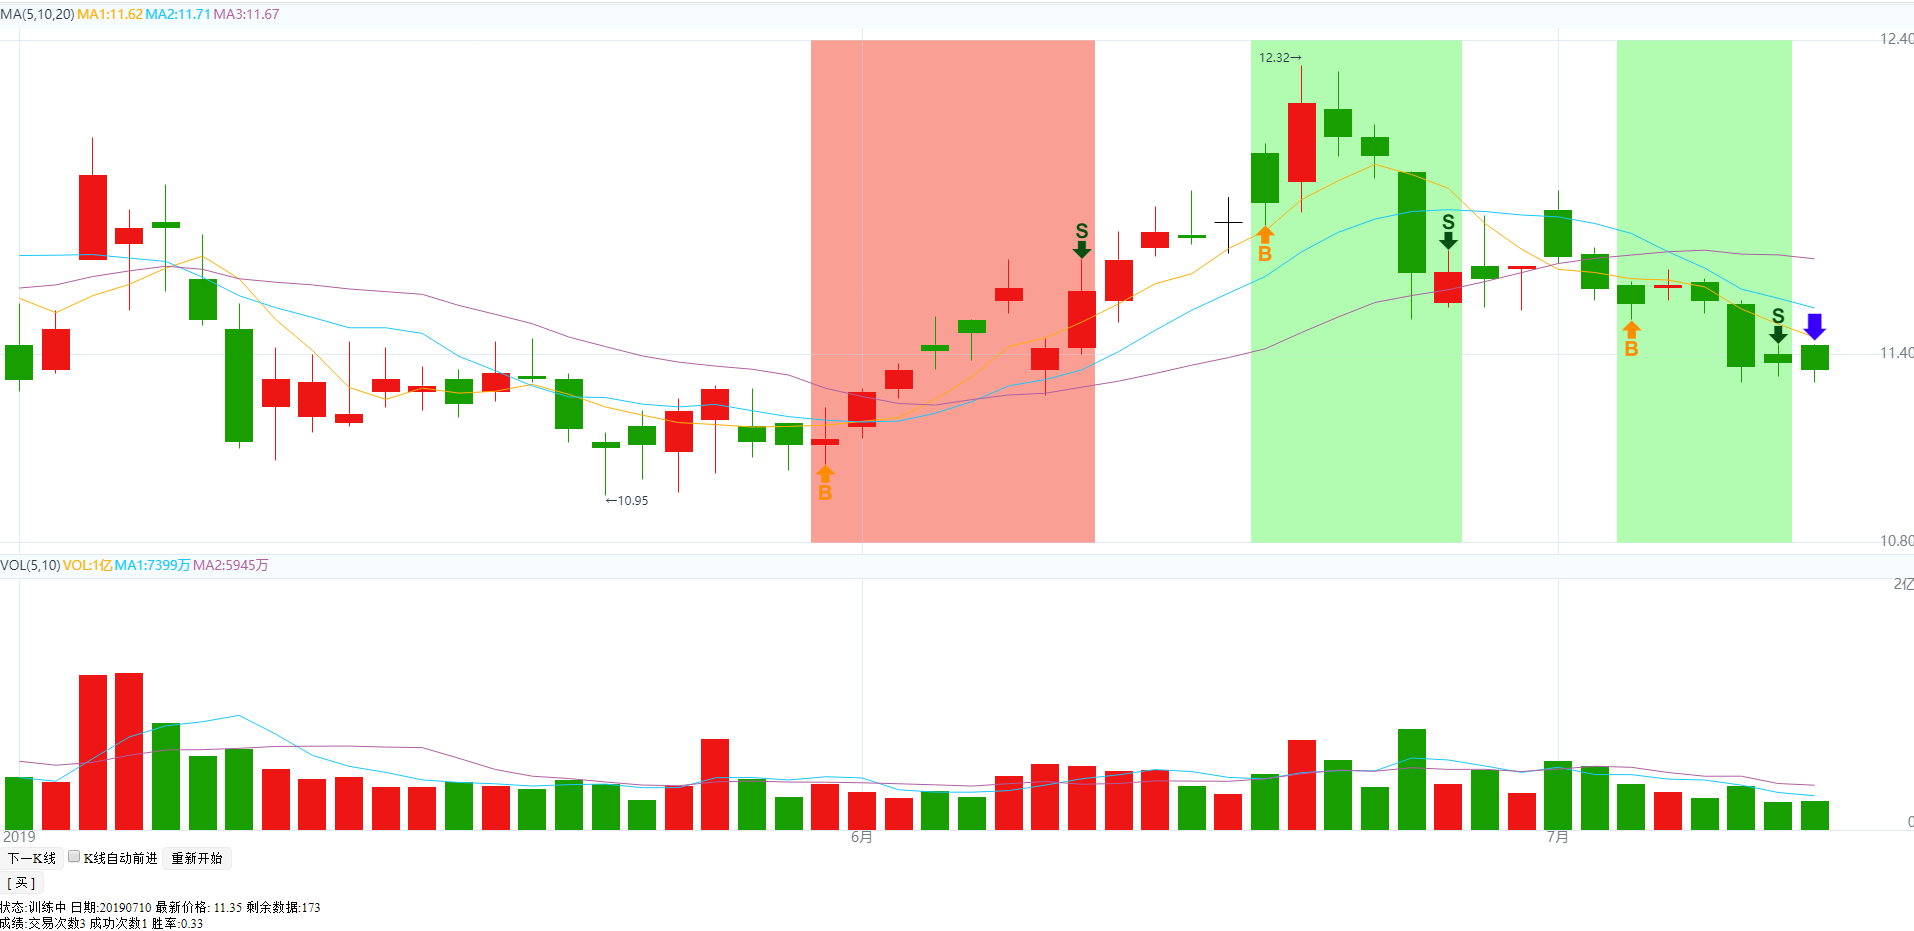
HQChart使用教程60-新版k线训练使用教程
HQChart使用教程60-新版k线训练使用教程 样例页面 K线训练重构 创建K线图 操作接口 下一个K线 自动/停止自动移动K线 买卖股票 K线移动监听事件 买卖数据计算 K线背景色设置功能 完整代码 HQChart代码地址 如果教程或hqchart对你有帮助, 请在git上star,教程点下赞 。谢谢~~ 样例页面 手机端页面 https://opensource2.zealink.com/h...